Uncovering An Price Outlier in our Public Homes
# A price outlier
On my Singapore public housing resale market past transaction search tool, I had a scatter plot that compares home prices with prices per area ( square feet / metres ). The plot shows a general positive and linear correlation between home prices and price per area. Homes with a higher price per square area should fetch higher overall prices. However, one interesting data point stuck out on the left top corner of the scatter plot. Hover over that data point to find out more information about that transaction.
Fig 1 - Can you spot which data point is the odd one out?
With a resale transaction price of around 1.5 million SGD, this public house’s price per square foot is much lower than the overall market trend. Looking at the other attributes of that sale, I the property could costs so much because of its sheer size, standing at almost 4,000 square feet. For context, my understanding is that family-sized public flats launched more recently in Singapore are only around 1,000 square feet. At its point of sale, the home only has around 47 years of lease left, which is on the lower end. Singapore public homes are sold from the government with a 99-year lease. On the expiring of its lease, the property in theory is to be returned to the Singapore government at zero value.
# Similar price points
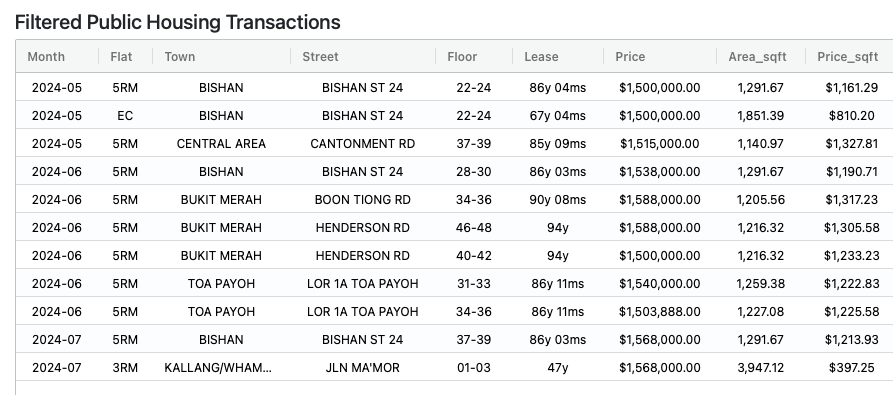 Fig 2 - Table of 1.5 million dollar public resale homes
During this 6 month period ( Feb to Aug 2024 ), there were 11 other public home resale transactions priced at SGD 1.5 million or greater, as listed in the table above. Below are their respective data points in the scatter plots comparing their overall prices with their price per square feet, and their overall prices with their remaining lease.
Fig 3 - Scatter Plot of Home Prices versus Price per Square Feet
Fig 4 - Scatter Plot of Home Prices versus Lease Left at point of sale
Here is a deeper look at the attributes of 1.5 million dollar public homes.
Price Per Square Feet However, among all these transactions, our outlier public home sale has the lowest price per square feet ( psf ) at only 397 SGD, followed by a sale at Bishan for 810 SGD. The rest had psf that were greater than 1,000 SGD.
Area Interestingly, the Kallang / Whampoa sale had the largest area at 3,947 square feet, followed by the Bishan sale, at 1,851 square feet. The other 1.5 million SGD or greater public homes sold had an area of around 1,200 square feet only ( still considered family-sized public homes ).
Remaining Lease Lastly, the Kallang / Whampoa sale had the least lease left, with only 47 years left, while the Bishan sale had 67 years of lease left. The other 1.5 million SGD or greater public homes sold had around 90-80+ years of lease left.
Location One thing I couldn’t compare were the locations of these public homes. I am thinking of the best way to add location search into my search tool in the near future. Maybe in the form of a map layer or something.
# Similar locations
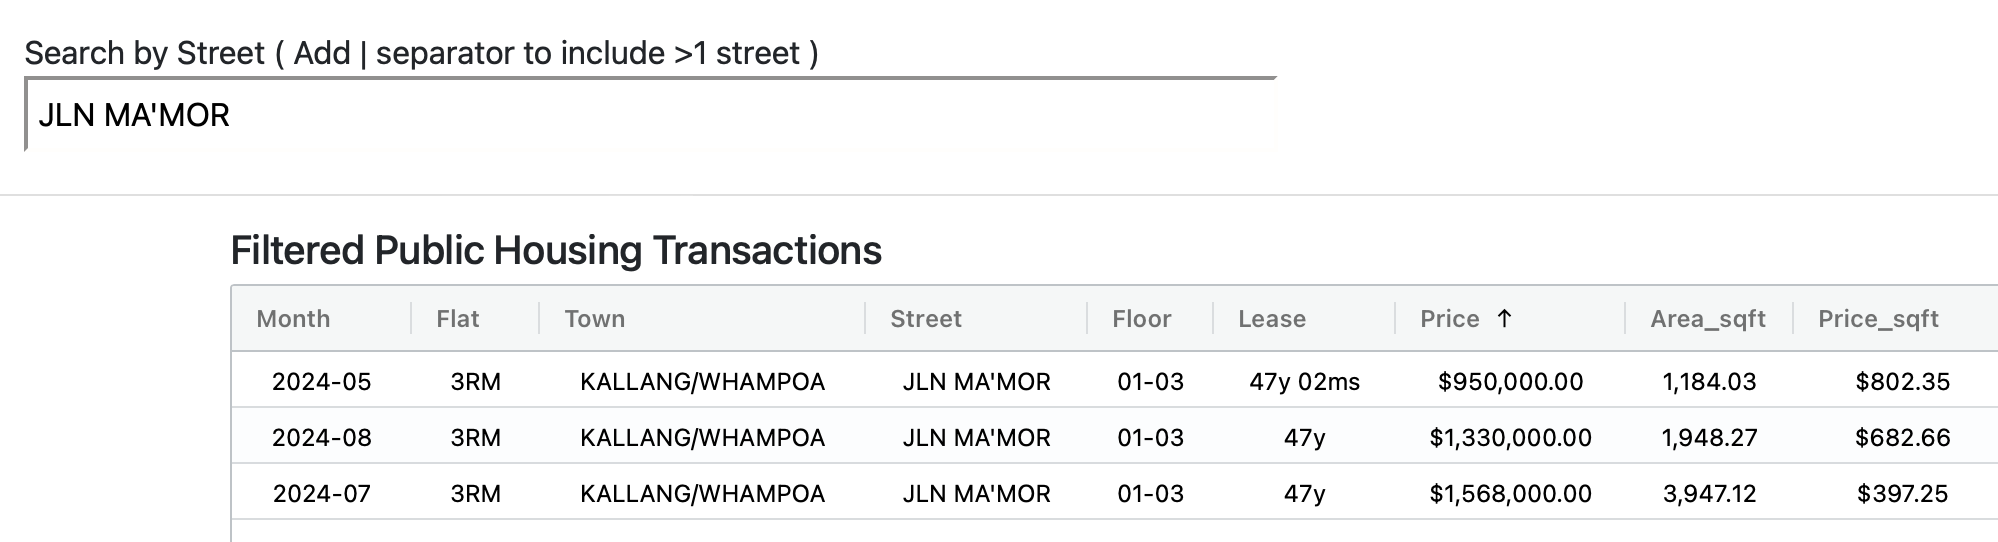 Fig 5 - Million Dollar Jalan Mammor Public Home Sales
In the last 6 months, there were 3 transactions along this street. All these flats had quite little remaining lease, this area should be a relatively old neighbourhood. Their low remaining lease and close proximity location, we see an interesting interplay of price per square feet, size and overall price. While the larger flat is costing more overall, we do see its price per square feet drop quite substantially.
Being a bit curious myself, I did some Google Map search to see the region. This is when I realised that this area has some of Singapore's rare landed public homes ! This may explain why one such public flat to be close to 4000 square feet, but also provides some kind of premium being a type of “landed home”, compared to other public homes in Singapore. No wonderful these units were all on 1-3 floors, where I assume these were all just first floor units.
Image Credit: Google Maps
# Concluding thoughts
I realised that these property sales have already been covered by some Singapore media outlets like 99.co and Mothership some time ago. I was just too numb to these million-dollar public home narratives to read these articles these days. This was why I decided to do my own analytics digging into the data that is available to us all. And while I missed out these articles previously, identifying these unique public home sales myself got me intrigued about these sales in my own ways!
Some last considerations here are that given that a household can afford a 1.5 million SGD public home, why did they not consider a private property instead? Was location so important to them? Or was it the ability to pay 1.5 million SGD for a landed home feel? Wouldn’t they be worried about their home being worthless once their lease is up after 47 years? Naturally, only the buyer of that public resale home will know the answers to these questions. Neither is it for me to judge their personal home purchase too.
Overall, I felt this was a good example of how data visualisations can reveal interesting patterns that we may never had realise! I hope this data exploratory piece was an as interesting a read as it was for me to investigate and write. I also hope that this is a good example of how my tool can potentially help home buyers and sellers understand more about the state of our current Singapore public housing market.
Tags: Public Housing | Million Dollar Homes |